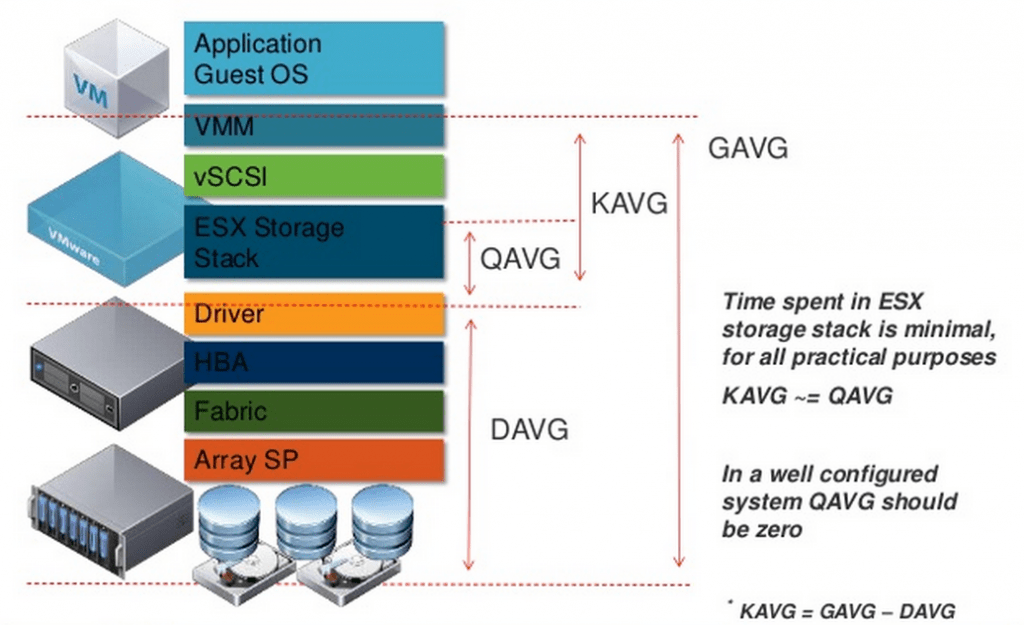
One of the common problems in software-defined datacenters is the latency of the virtual machine disk which will slow down the application and increase response time. The virtual machine owner or user declares that its system is slow and the question arises whether the slowdown is coming from a virtual infrastructure or storage device or operating system and how to troubleshoot it?
In this section, we will discuss the storage parameters in VMware ESXi and show you how troubleshot disk latency in your environment. Lets SSH to ESXi host and leverage esxtop command to identify the problem. Esxtop allows monitoring and collection of data for all system resources: CPU, memory, disk, and network.
SSH to ESXi and type “esxtop“, a window like the following appears which shows by default information about CPU.

Type “d” to switch into disk adapter mode and find good information. By default, the screen will be refreshed every 5 seconds, change this by typing “s” and then “2” to update statistics every 2 seconds.

So let’s see what these statistics are and how we can use them.
| CMD/s: | Number of commands issued per second. In most cases, it is equal to IOPs unless there are a lot of metadata operations (SCSI commands) |
| READS/s | The number of read commands issued per second. |
| WRITES/s | The number of write commands issued per second. |
| DAVG/cmd | The average response time of the device in milliseconds per command. |
| KAVG/cmd | The average response time of the command spends in the VMkernel. |
| GAVG/cmd | The is Guest average response time, which calculated with the formula: DAVG + KAVG = GAVG |
These counters report latency at three different points in the ESX storage stack. In the context of the figure below, the latency counters in esxtop report the Guest (GAVG), ESX Kernel (KAVG) and Device (DAVG) latencies. As you see GAVG is the sum of DAVG and KAVG counters.

If you have high latency in the DAVG parameter, you should look for a problem in your underlying infrastructure, as you see in the figure above, DAVG is a 20 millisecond which related to HBA, Fabric, Array SP. In order words, you should check the storage controller, SAN switch, cable, check the CPU utilization of the controller, the disk utilization of storage (LUN) and any physical equipment that includes between the host and storage device, and including the device itself.
If you are too latency in KAVG, it is related to your virtual infrastructure and operating system. Start from the bottom layer which is datastores. Find out the number of virtual machines are in one datastore and try to distribute virtual machines among datastores. Each datastore has a queue, and if there are too many virtual machines on it, it makes the requests to be queued and the commands are being responded with delay. Another reason would be virtual machine storage controllers, what kind of controllers are you using? if you use anything other than Paravirtual and your operating system supports it, change your controller to Paravirtual. Paravirtual support more IOPS and less CPU utilization. I strongly recommended you to use a separate controller for each disk, because each SCSI controller has a queue and assigning two heavy virtual disks to a SCSI controller result in performance degradation.
References
https://communities.vmware.com/docs/DOC-9279
https://kb.vmware.com/s/article/1008205
http://www.yellow-bricks.com/esxtop/
https://kb.vmware.com/s/article/2053145
Hi,
Good explaination and usefull visual.,
Only thing missing would be “what numbers to expect from good to poor performances”
tx!
Hi! Sorry for late reply! I was off for a month!
The expected numbers vary depending on the environement, but in general:
KAVG/cmd should be close to 0 ms
DAVG/cmd should be less than 10 ms, in some cases, between 10 and 20 ms is still OK. more than this value often causes application performance issues.