Super metrics in vRealize Operations are custom metrics that you can define using existing metrics and mathematical functions. They allow you to create new metrics that are specific to your environment and can help you gain deeper insights into the performance and health of your infrastructure.
With super metrics, you can perform complex calculations and aggregations of the data collected by vRealize Operations and display the results in custom dashboards and reports. In this post, I’ll show you how to use super metrics to calculate the metrics of your choice, create a dashboard for them, and then generate a report. In this post, I want to show you how to create a simple super metric and how it works.
Example: Virtual Machine Snapshot super metric that calculates the number of VM snapshots older than one week can be very helpful in identifying and managing snapshot sprawl in your virtual environment.
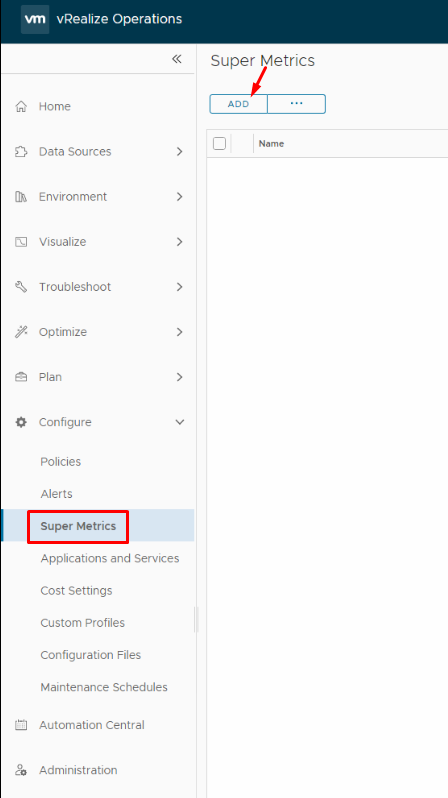
1- Log in to the vRealize Operations user interface and from the left menu select Super Metrics under Configure and then click on Add to create a new super metric.
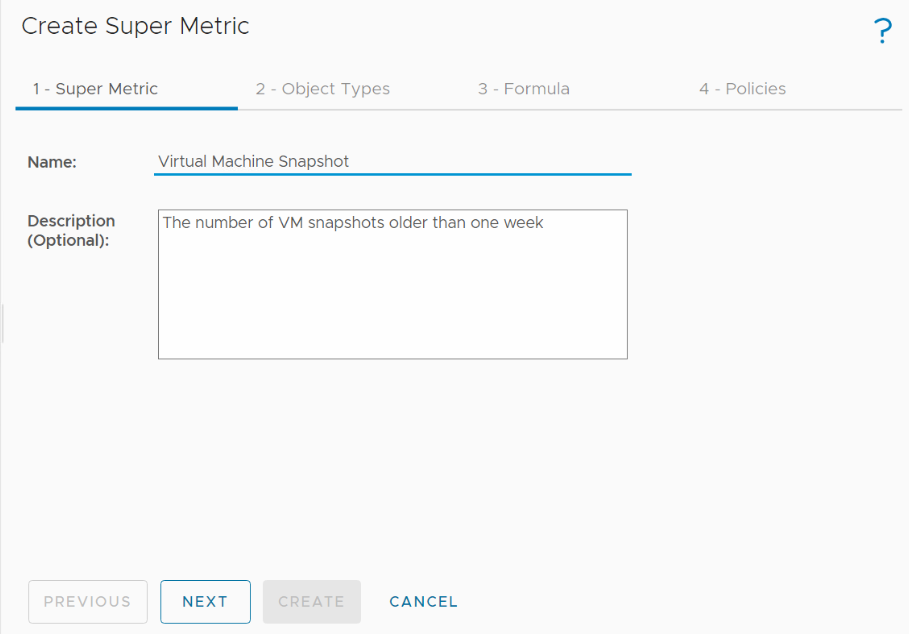
2- Give your super metric a name and a description that explains what it does.
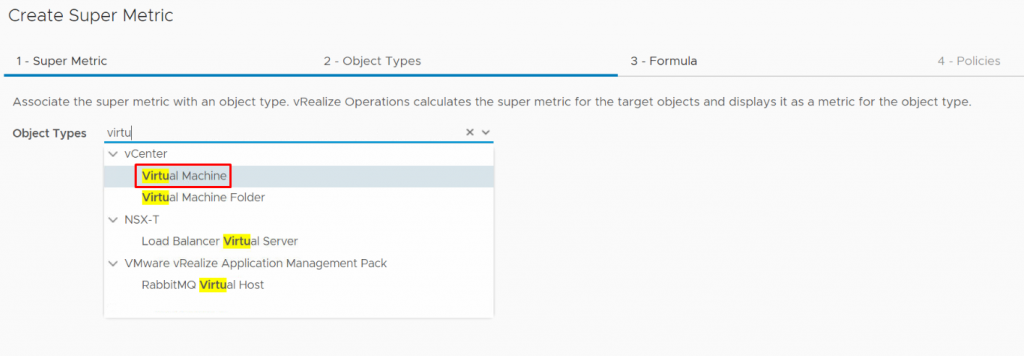
3- Select one or more objects that you want to use as inputs to your super metric. You select the objects involved in the formula you want to use. Since I wanted to get snapshots of virtual machines, I just need to add the virtual machine as an object type.
4- Choose the mathematical function that you want to use to combine the input metrics. For example, I should count the age of the snapshot, and if it is greater than 7, I should be shown that virtual machine, but if a virtual machine has a snapshot for 6 days or less, it would not be included. The following GIF shows you how I wrote and validated this formula and how I used the preview to check its functionality.
count({This Resource:diskspace|snapshot|snapshotAge, where = ($value > 7)})
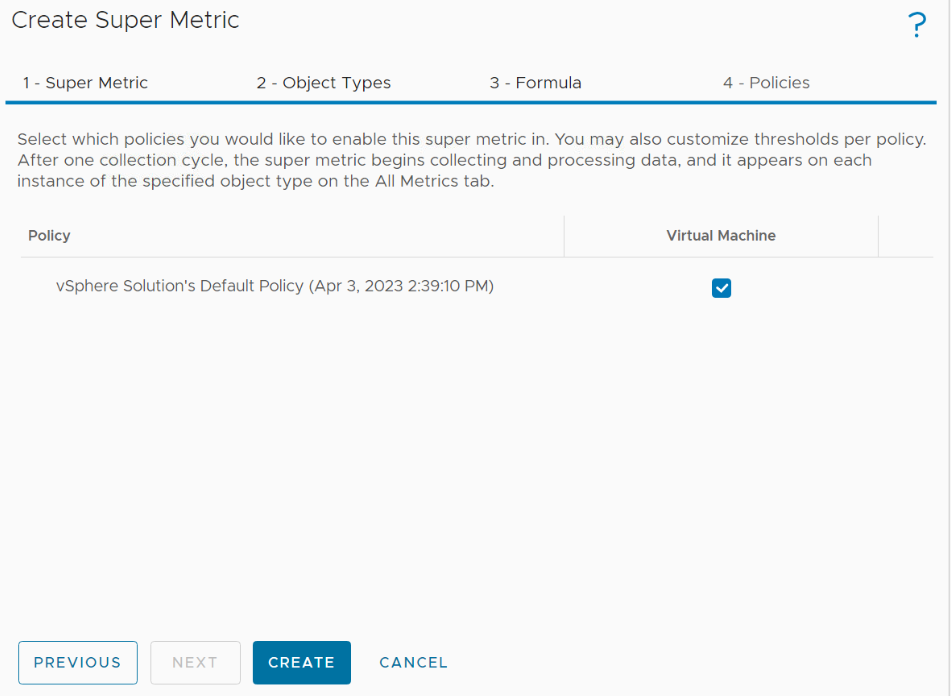
5- Select a policy that you want to associate with the super metric. I haven’t created a policy yet, so I have only one choice and click Create.
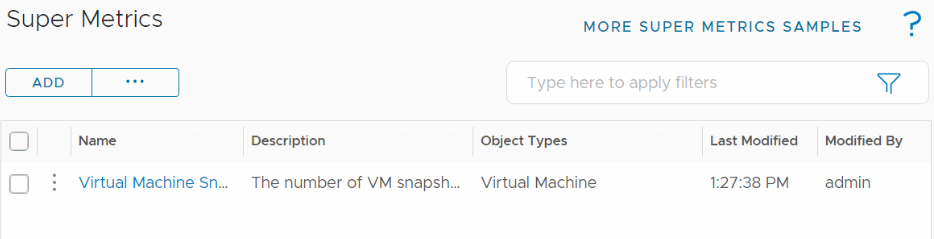
6- As you see the super metric was successfully created and it is listed.
7- Now you can see this super metric under virtual machine configurations or create a dashboard for it. Under Environment, click Object Browser and use the inventory tree to locate and select a virtual machine, and then under the Metrics tab, select Super Metrics you will see the newly created super metrics.
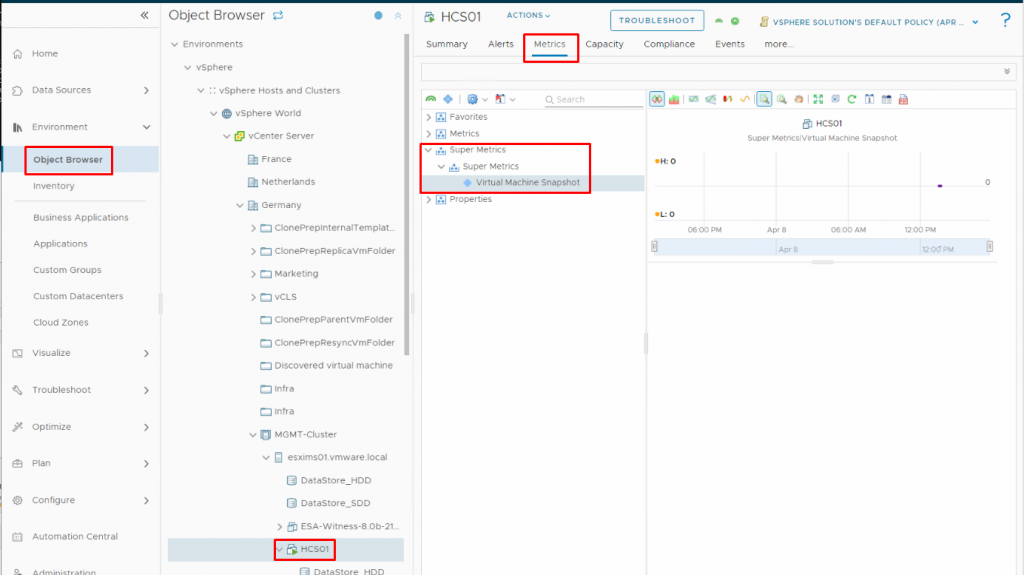
The result of this super metric for this virtual machine is zero, which means that this virtual machine has no snapshot whose age is older than 7 days.
As you can see in the steps above, we need to specify what objects are involved, what metrics we will use, and how the metrics will be combined or compared before you create a super metric. In more complex scenarios, you may need to think more and more about it to create a better super metric that meets your needs.
In the next post, I will first create a view for this super metric and then create a dashboard.