In the last post, I created a simple super metric, and now I want to show you how to create a view and dashboard for that super metric.
Before I go through the configuration steps, I want to explain some terms in vRealize Operations. vRealize Operations displays the information you need in a variety of ways: with views, widgets, dashboards, and reports.
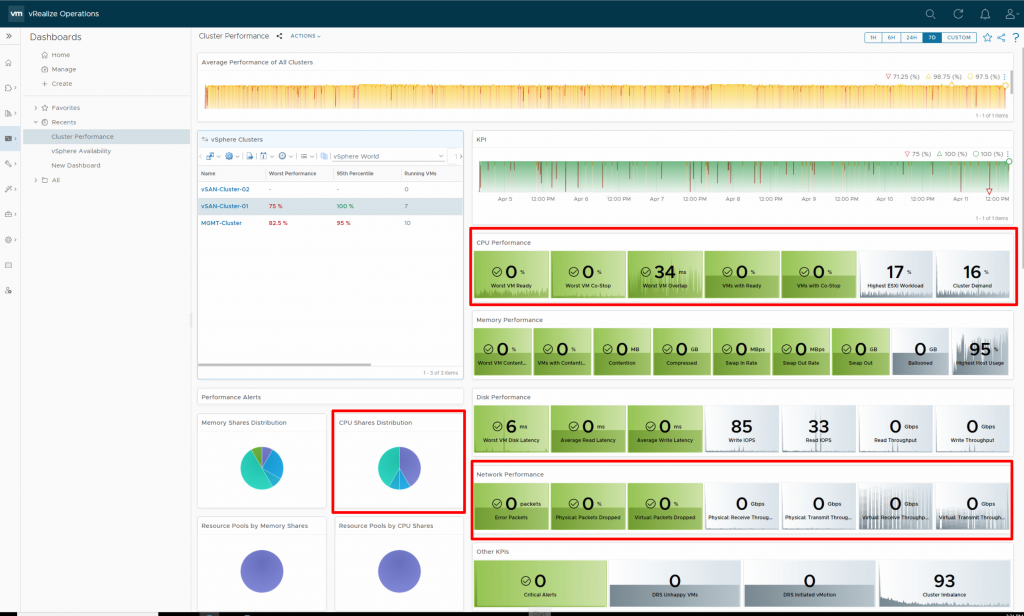
The following image is a built-in dashboard called Cluster Performance and there are several building blocks in it, some of which I marked with a red box! These blocks are widgets and somehow views! So dashboards are interfaces that you can use to monitor the performance and state of a virtual environment and they contain Views and Widgets!
A widget is a pane on a dashboard that displays information about objects, metrics, attributes, and processes in the environment. A view display data, based on collected information for an object or groups of objects from a specific perspective depending on the view type. You can incorporate views in dashboards using View Widget, So views can be added to dashboards in the form of widgets!
A report is a way of presenting information about the health, performance, and capacity of the virtualized environment based on predefined or custom views and dashboards in a format (PDF or CSV) that can be easily shared with others.
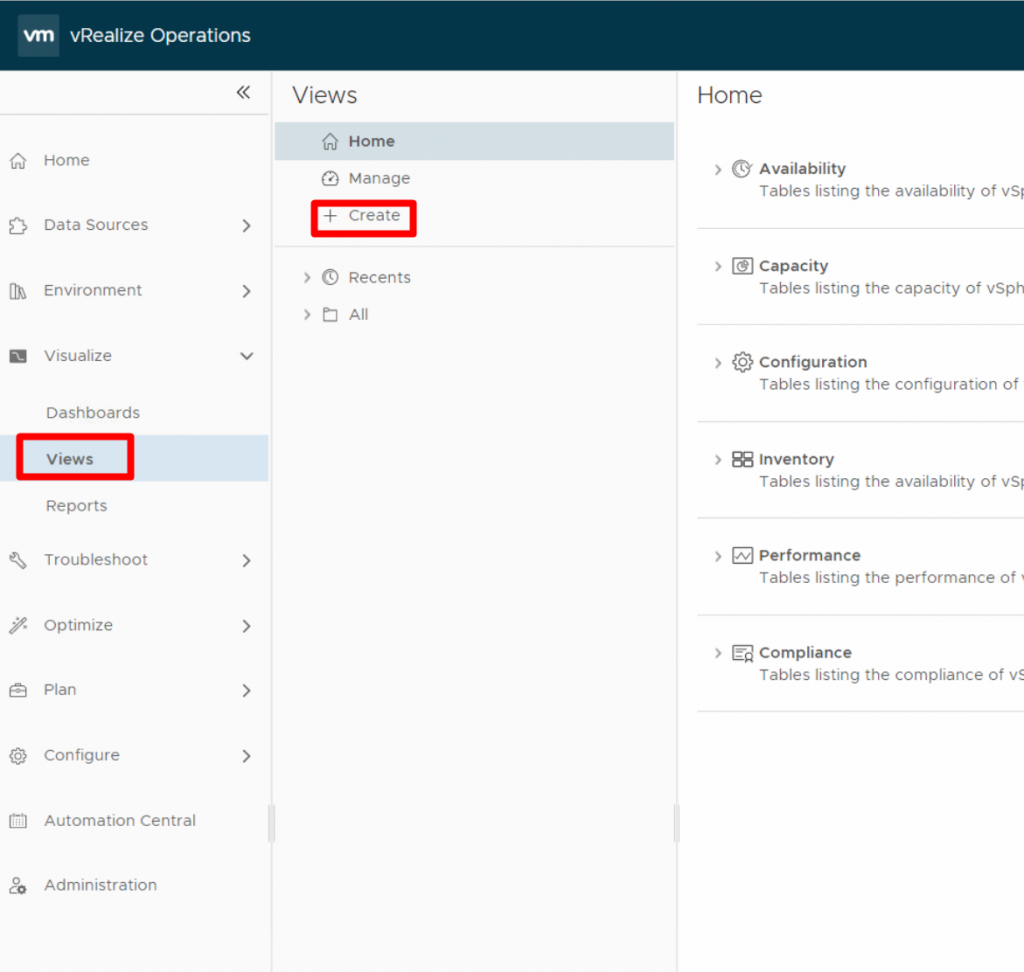
1- Now I will create a new view for my super metric and then create a new dashboard and add that view to this dashboard using the view widget. Log in to the vRealize Operations user interface and from the left menu select Views under Visualize and click on Create.
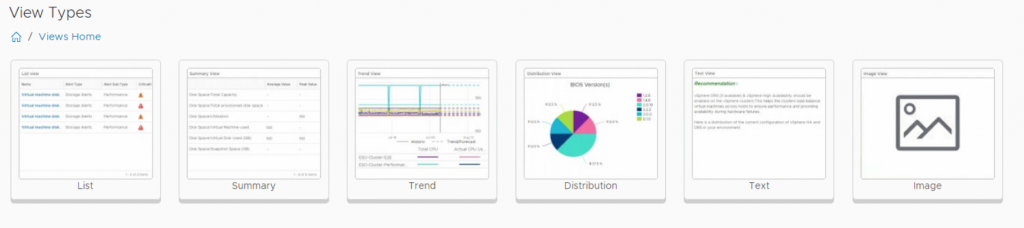
2- Select one of the following view types based on your needs, for example, I want to list virtual machines whose Snapshots’ age are older than one week, so I select List.
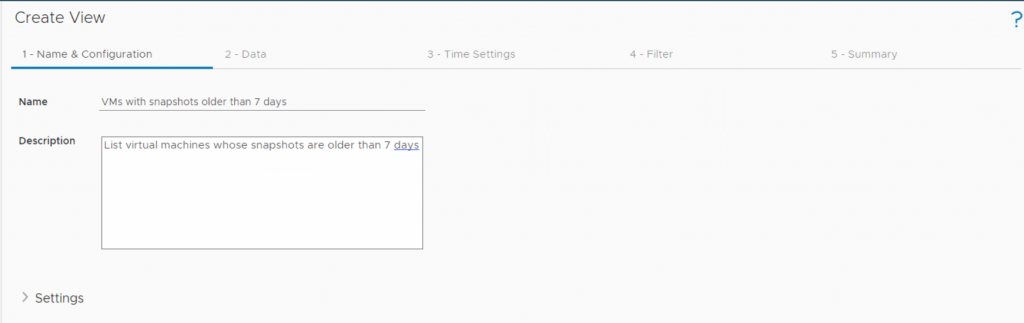
3- Give the view a name and a description.
4- Click Add Subjects to select the object type for which you want to create a view from the drop-down menu, which in this case is a virtual machine, and then displays all metrics related to the type of virtual machine. It also contains super metrics, so I select the super metric and then get a preview with a random virtual machine. If I change the source to vSphere World, the super metric value is displayed for all virtual machines.
5- Leave the default configurations and click Next.
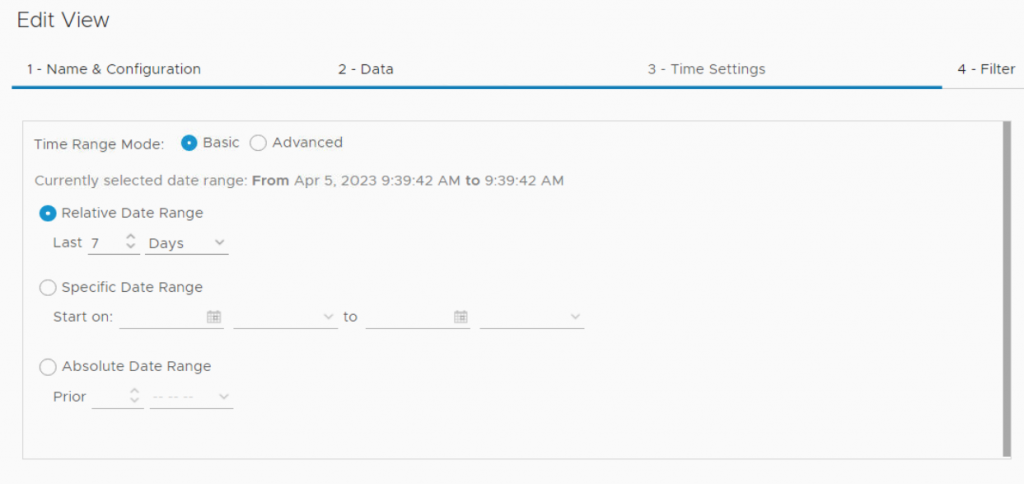
6- The Filter option allows us to filter output according to the desired view. For example, I want to show only virtual machines whose snapshots are older than a week, and I don’t want to see other virtual machines in this view. So I define a new filter by selecting the super metric and setting the condition to show only virtual machines whose super metric value is equal to one, and then click Create.
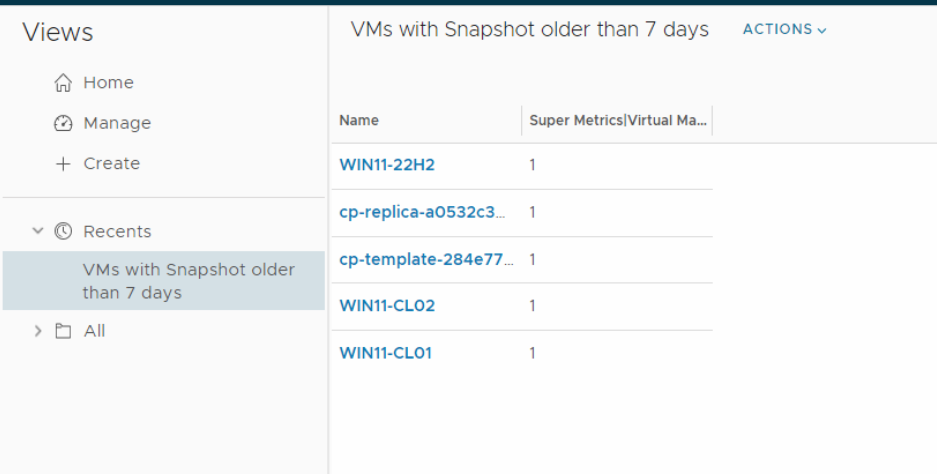
7- As you can see, the result is exactly what I wanted. The view has been successfully created and now it’s time to add it to a dashboard.
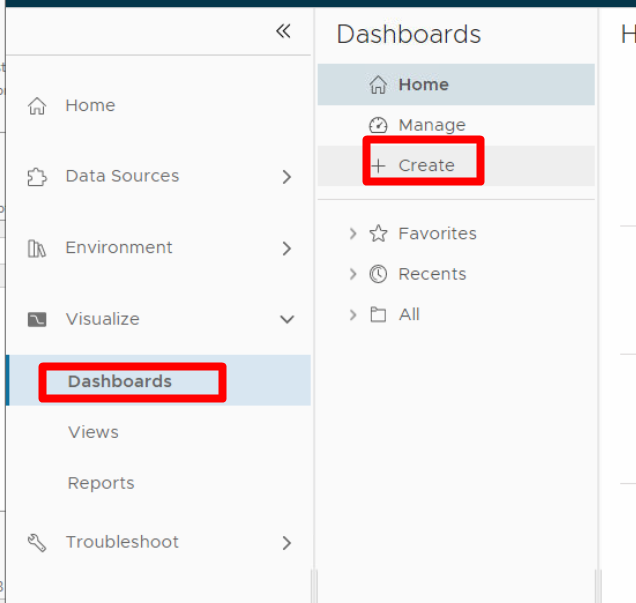
8- From the left menu select Dashboards under Visualize and then click on Create.
9- Enter a name for the dashboard and choose the layout for the dashboard by adding widgets or views to the dashboard. Use the toggle button to switch between widgets and views. In the last step, I created a view, so I switch to view and add a list to the dashboard. If you remember, I mentioned above that we can add a view to a dashboard with aim of the view widget, and now when I click the edit button, you see the text “edit widget” under the button! even though I added a view to the dashboard, it is actually a widget! which type of widget? it is a view widget! We have several types of widgets that you can find more information about them at this link. Widget Definitions List (vmware.com)
10- Now click on the edit widget to configure the settings for this widget. Enter a name for this widget and then select a refresh interval for this widget if you want to refresh the data in this widget regularly; otherwise, it will be refreshed when you open the dashboard or manually click the refresh button.
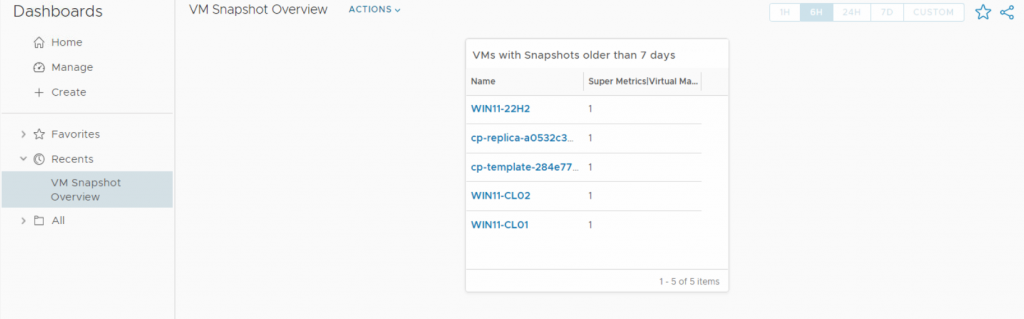
Active Self Provider to define the input objects for this widget. Under Input Data specify input for the widget, in my case, I select vSphere Hosts and Clusters and then vSphere World. Under Output Data, I select the view created earlier and click Save to display the view in the dashboard. Now the dashboard shows virtual machines whose snapshots are older than 7 days! Save the dashboard by clicking on the Save button.
11- This dashboard can now be shared with other users or further customized by adding more widgets to it.
I hope this is informative for you!
Is it possible to show the user who created the VM as well?
Hi,
Yes it is also possible.